

RESEARCH NOTES

How to present research data?
Figure 1A. Changes of HbA1c level after diabetic self-management program.
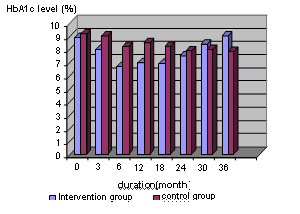
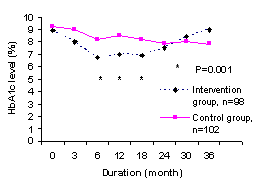
Figure 1B. Changes of HbA1c level after diabetic self-management program.
STATISTICS
Papers are often rejected because wrong statistical tests are used or interpreted incorrectly. A simple approach is to consult the statistician early. Bearing in mind that most readers are not statisticians, the reporting of any statistical tests should aim to be understandable by the average audience but sufficiently rigorous to withstand the critique of experts.
- Simple statistic such as mean and standard deviation, median, normality testing is better reported in text. For example, age of group A subjects was normally distributed with mean of 45.4 years old kg (SD=5.6). More complicated statistical tests involving many variables are better illustrated in tables or graphs with their interpretation by text. (See section on Tables).
- We should quote and interpret p value correctly. It is preferable to quote the exact p value, since it is now easily obtained from standard statistical software. This is more so if the p value is statistically not significant, rather just quoting p>0.05 or p=ns. It is not necessary to report the exact p value that is smaller than 0.001 (quoting p<0.001 is sufficient); it is incorrect to report p=0.0000 (as some software apt to report for very small p value).
- We should refrain from reporting such statement: “mean systolic blood pressure for group A (135mmHg, SD=12.5) was higher than group B (130mmHg, SD= 9.8) but did not reach statistical significance (t=4.5, p=0.56).” When p did not show statistical significance (it might be >0.01 or >0.05, depending on which level you would take), it simply means no difference among groups.
- Confidence intervals. It is now preferable to report the 95% confidence intervals (95%CI) together with p value, especially if a hypothesis testing has been performed.
CONCLUSION
The main core of the result section consists of text, tables and graphics. As a general rule, text provides narration and interpretation of the data presented. Simple data with few categories is better presented in text form. Tables are useful in summarising large amounts of data systemically and graphics should be used to highlight evidence and trends in the data presented. The content of the data presented must match the research questions and objectives of the study in order to give meaning to the data presented. Keep the data and its statistical analyses as simple as possible to give the readers maximal clarity.
REFERENCES
- International Committee for Medical Journal Editors. Uniform requirements for manuscripts submitted to biomedical journals: Writing and Editing for Biomedical Publication. [HTML] [PDF]
FURTHER READINGS
- Hall GM (ed). How to write a paper. 3rd Edition. London: BMJ Publishing Group, 2003.
- Grange RI. Saving time, effort and tears: a guide to presenting results. Br J Urol. 1998;81(2):335-9 [PubMed]
- Huth EJ. Writing and publishing in Medicine. 3rd ed. Maryland: Williams & Wilkins, 1999.
- Lang T, Secic M. How to report statistics in medicine: Annotated guidelines for authors, editors and reviewers. Philadelphia: American College of Physicians, 1997.